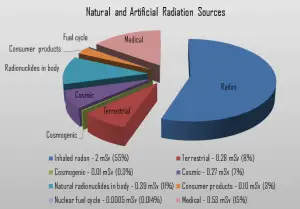
 Radiation is all around us. In, around, and above the world we live in. It is a natural energy force that surrounds us. It is a part of our natural world that has been here since the birth of our planet. All living creatures, from the beginning of time, have been, and are still being, exposed to ionizing radiation. Ionizing radiation is generated through nuclear reactions, nuclear decay, by very high temperature, or via acceleration of charged particles in electromagnetic fields.
Radiation Exposures from Electricity Generation
In this chapter, we would like to discuss a very interesting fact. It is generally known, the increasing use of nuclear power and electricity generation using nuclear reactors will lead to a small but increasing radiation dose to the general public. But it is not generally known, power generation from coal also creates additional exposures, and, what is more interesting, while exposure levels are very low, the coal cycle contributes more than half of the total radiation dose to the global population from electricity generation. The nuclear fuel cycle contributes less than one-fifth of this. The collective dose, which are defined as the sum of all individual effective doses in a group of people over the time period or during the operation being considered due to ionizing radiation, is:
- 670-1400 man Sv for coal cycle, depending on the age of the power plant,
- 130 man Sv for nuclear fuel cycle,
- 5-160 man Sv for geothermal power,
- 55 man Sv for natural gas
- 0.03 man Sv for oil
Yes, these results should be seen from the perspective of the share of each technology in worldwide electricity production. Since 40 per cent of the world’s energy was produced by the coal cycle in 2010, and 13 per cent by nuclear, the normalized collective dose will be about the same:
- 0.7 – 1.4 man Sv/GW.a (man sievert per gigawatt year) for coal cycle
- 0.43 man Sv/GW.a (man sievert per gigawatt year) for nuclear fuel cycle
Special Reference: Sources and effects of ionizing radiation, UNSCEAR 2016 – Annex B. New York, 2017. ISBN: 978-92-1-142316-7.
The above doses are related to public exposure. If we consider occupational exposure, regarding the mining of rare earth metals needed for construction, by far the largest collective dose to workers per unit of electricity generated assessed by the UNSCEAR came from solar power, followed by wind power. For solar power, occupational collective dose normalized to energy is a factor of forty and eighty larger than for the nuclear fuel cycle and coal cycle, respectively.
Note that, the collective effective dose is often used to estimate the total health effects, but according to the ICRP this should be avoided (see more: Collective Dose).
Radiation Exposures from Nuclear Fuel Cycle
The nuclear fuel cycle is a process chain consisting of a series of differing stages. In general, nuclear fuel cycle consists of steps in the front end (the preparation of the fuel), steps in the service period (fuel burnup), and steps in the back end (reprocessing or disposal of spent nuclear fuel). Radiation exposures from nuclear fuel cycle are, according to UNSCEAR, evaluated from entire life cycle of nuclear fuel and this includes:
- uranium mining, milling and mill tailings,
- fabrication of fuel assemblies
- power plant operation (except accidents),
- spent fuel storage or reprocessing,
- disposal of radioactive waste,
- decommissioning activities.
The collective dose, which results from nuclear fuel cycle is:
- 130 man Sv for nuclear fuel cycle,
Almost half of the contribution to public exposures from the nuclear fuel cycle comes from discharges of natural radionuclides during uranium mining and milling activities.
The normalized collective dose (per gigawatt and year) is:
- 0.43 man Sv/GW.a (man sievert per gigawatt year) for nuclear fuel cycle
Special Reference: Sources and effects of ionizing radiation, UNSCEAR 2016 – Annex B. New York, 2017. ISBN: 978-92-1-142316-7.
In the following points we try to express ranges of radiation exposure from electricity generation together with doses from, which can be obtained from various sources.
- 05 µSv – Sleeping next to someone
- 09 µSv – Living within 30 miles of a nuclear power plant for a year
- 1 µSv – Eating one banana
- 3 µSv – Living within 50 miles of a coal power plant for a year
- 10 µSv – Average daily dose received from natural background
The above doses are related to public exposure. If we consider occupational exposure, regarding the uranium mining, power plant workers etc., the collective dose is higher especially uranium miners. The miners are surrounded by rocks and sloshing through ground water that is exuding radon.
Note that, the collective effective dose is often used to estimate the total health effects, but according to the ICRP this should be avoided.
Radiation Exposures from Coal Cycle
The public is also exposed to radiation from so called “enhanced sources of naturally occurring radioactive material”. This means also industries such as metal mining, coal mining and power production from coal creates additional exposures due to densification of naturally occurring radionuclides. Coal is the predominant source of energy used to produce electricity today. Coal cycle is a process chain consisting of a series of differing stages. For the coal cycle, the life cycle includes:
- coal mining,
- power plant operation,
- coal ash deposits.
According to the UNSCEAR, power generation from coal and entire coal cycle contribute more than half of the total radiation dose to the global population from electricity generation. This statement will seem paradoxical to many readers, since it’s not commonly known that non-nuclear energy sources release any radiation into the environment. But power generation from coal also creates additional exposures to public. Even nuclear fuel cycle releases less radiation into the environment than coal cycle and any other major energy source.
The problem is coal itself and especially coal ash (fly ash). Coal, a combustible black or brownish-black sedimentary rock, contains a substantial amount of the radioactive elements uranium and thorium. According to the UNSCEAR, the average specific activity of both uranium-238 and thorium-232 in coal is generally around 20 Bq/kg (range 5-300 Bq/kg). Coal mines in Freital, Germany, which have uranium concentrations of 15000 Bq/kg coal, are an exception. Burning coal gasifies its organic materials, concentrating its inorganic components into the remaining waste, called fly ash. Around 10% of coal is fly ash. Fly ash is hazardous and toxic to human beings and some other living things, and fly ash also contains the radioactive elements uranium and thorium, which are concentrated by a factor of 10. It must be emphasized, even fly ash does not possess any health hazards to the public. There are a few restrictions on the use of fly ash in landfill and road construction. Most restrictions are on the use in building construction, where it can result in increased exposures especially from radon. In any case, we don’t want to cause any irrational fear of radiation from coal. It does not mean, that it must be dangerous. In case of radiation from electricity generation, the doses are usually very, very low. Moreover, these results cannot be used to determine whether one form of energy generation is preferable to another.
The collective dose, which results from coal cycle is:
- 670-1400 man Sv for coal cycle, depending on the age of the power plant,
When considering the amount of electricity generated in the year 2010 by each technology, the coal cycle resulted in the largest collective dose to the global public and workers combined, followed by the nuclear fuel cycle. Of the remaining technologies, geothermal energy and combustion of natural gas were the next largest contributors.
The normalized collective dose (per gigawatt and year) is:
- 0.7 – 1.4 man Sv/GW.a (man sievert per gigawatt year) for coal cycle
Special Reference: Sources and effects of ionizing radiation, UNSCEAR 2016 – Annex B. New York, 2017. ISBN: 978-92-1-142316-7.
In the following points we try to express ranges of radiation exposure from electricity generation together with doses from, which can be obtained from various sources.
- 05 µSv – Sleeping next to someone
- 09 µSv – Living within 30 miles of a nuclear power plant for a year
- 1 µSv – Eating one banana
- 3 µSv – Living within 50 miles of a coal power plant for a year
- 10 µSv – Average daily dose received from natural background
The above doses are related to public exposure. If we consider occupational exposure, regarding the coal mining and fly ash deposits, the collective dose is higher especially for coal miners. Coal miners as a group receive the largest collective dose of radiation, through enhanced exposure to naturally occurring radionuclides.
Note that, the collective effective dose is often used to estimate the total health effects, but according to the ICRP this should be avoided (see more: Collective Dose).
Health Effects of Radiation Exposures from Electricity Generation
We must emphasize, eating bananas, working as airline flight crew or living near coal or nuclear power plant increases your annual dose rate. But it does not mean, that it must be dangerous. In each case, intensity of radiation also matters. It is very similar as for heat from a fire (less energetic radiation). If you are too close, the intensity of heat radiation is high and you can get burned. If you are at the right distance, you can withstand there without any problems and moreover it is comfortable. If you are too far from heat source, the insufficiency of heat can also hurt you. This analogy, in a certain sense, can be applied to radiation also from radiation sources.

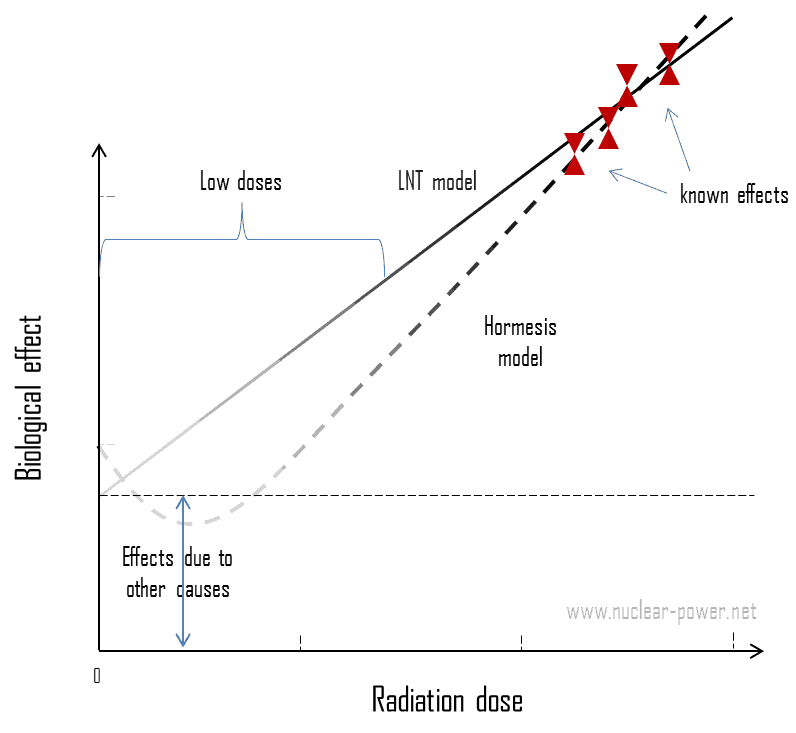
In case of radiation from electricity generation, we are talking usually about so called “low doses”. Low dose here means additional small doses comparable to the normal background radiation (10 µSv = average daily dose received from natural background). The doses are very very low and therefore the probability of cancer induction could be almost negligible. Secondly, and this is crucial, the truth about low-dose radiation health effects still needs to be found. It is not exactly known, whether these low doses of radiation are detrimental or beneficial (and where is the threshold). Government and regulatory bodies assume a LNT model instead of a threshold or hormesis not because it is the more scientifically convincing, but because it is the more conservative estimate. Problem of this model is that it neglects a number of defence biological processes that may be crucial at low doses. The research during the last two decades is very interesting and show that small doses of radiation given at a low dose rate stimulate the defense mechanisms. Therefore the LNT model is not universally accepted with some proposing an adaptive dose–response relationship where low doses are protective and high doses are detrimental. Many studies have contradicted the LNT model and many of these have shown adaptive response to low dose radiation resulting in reduced mutations and cancers. This phenomenon is known as radiation hormesis.
We hope, this article, Radiation Exposure from Electricity Generation, helps you. If so, give us a like in the sidebar. Main purpose of this website is to help the public to learn some interesting and important information about radiation and dosimeters.